ReMap 2022: Atlas of Regulatory Regions
This track hub represents the ReMap Atlas of regulatory regions which consists in a large scale integrative analysis of all Public ChIP-seq data for transcriptional regulators from GEO, ArrayExpress and ENCODE.
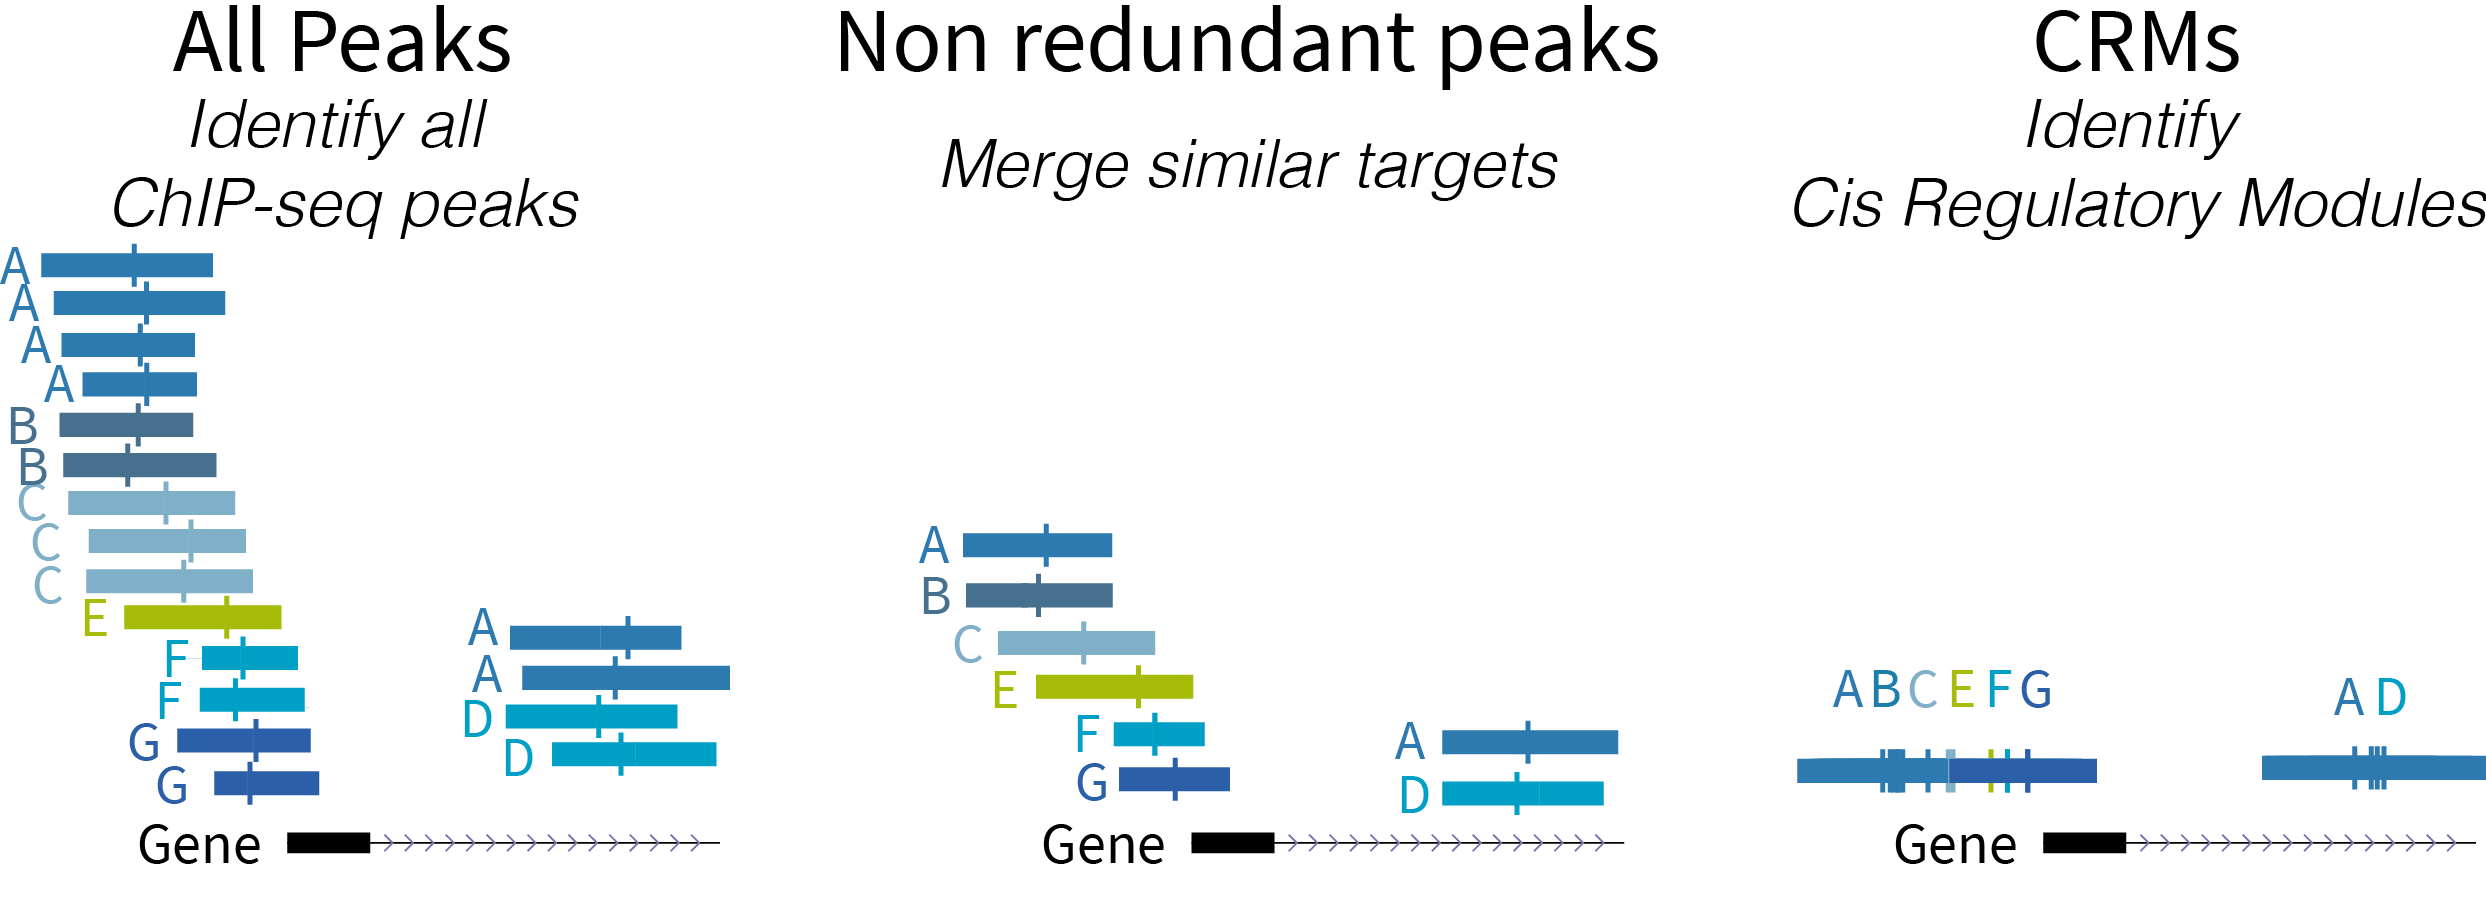
Below a schematic diagram of the types of regulatory regions:
- ReMap 2022 Atlas (all peaks for each analyzed datasets)
- ReMap 2022 Non redundant peaks (merged similar target)
- ReMap 2022 Cis Regulatory Modules
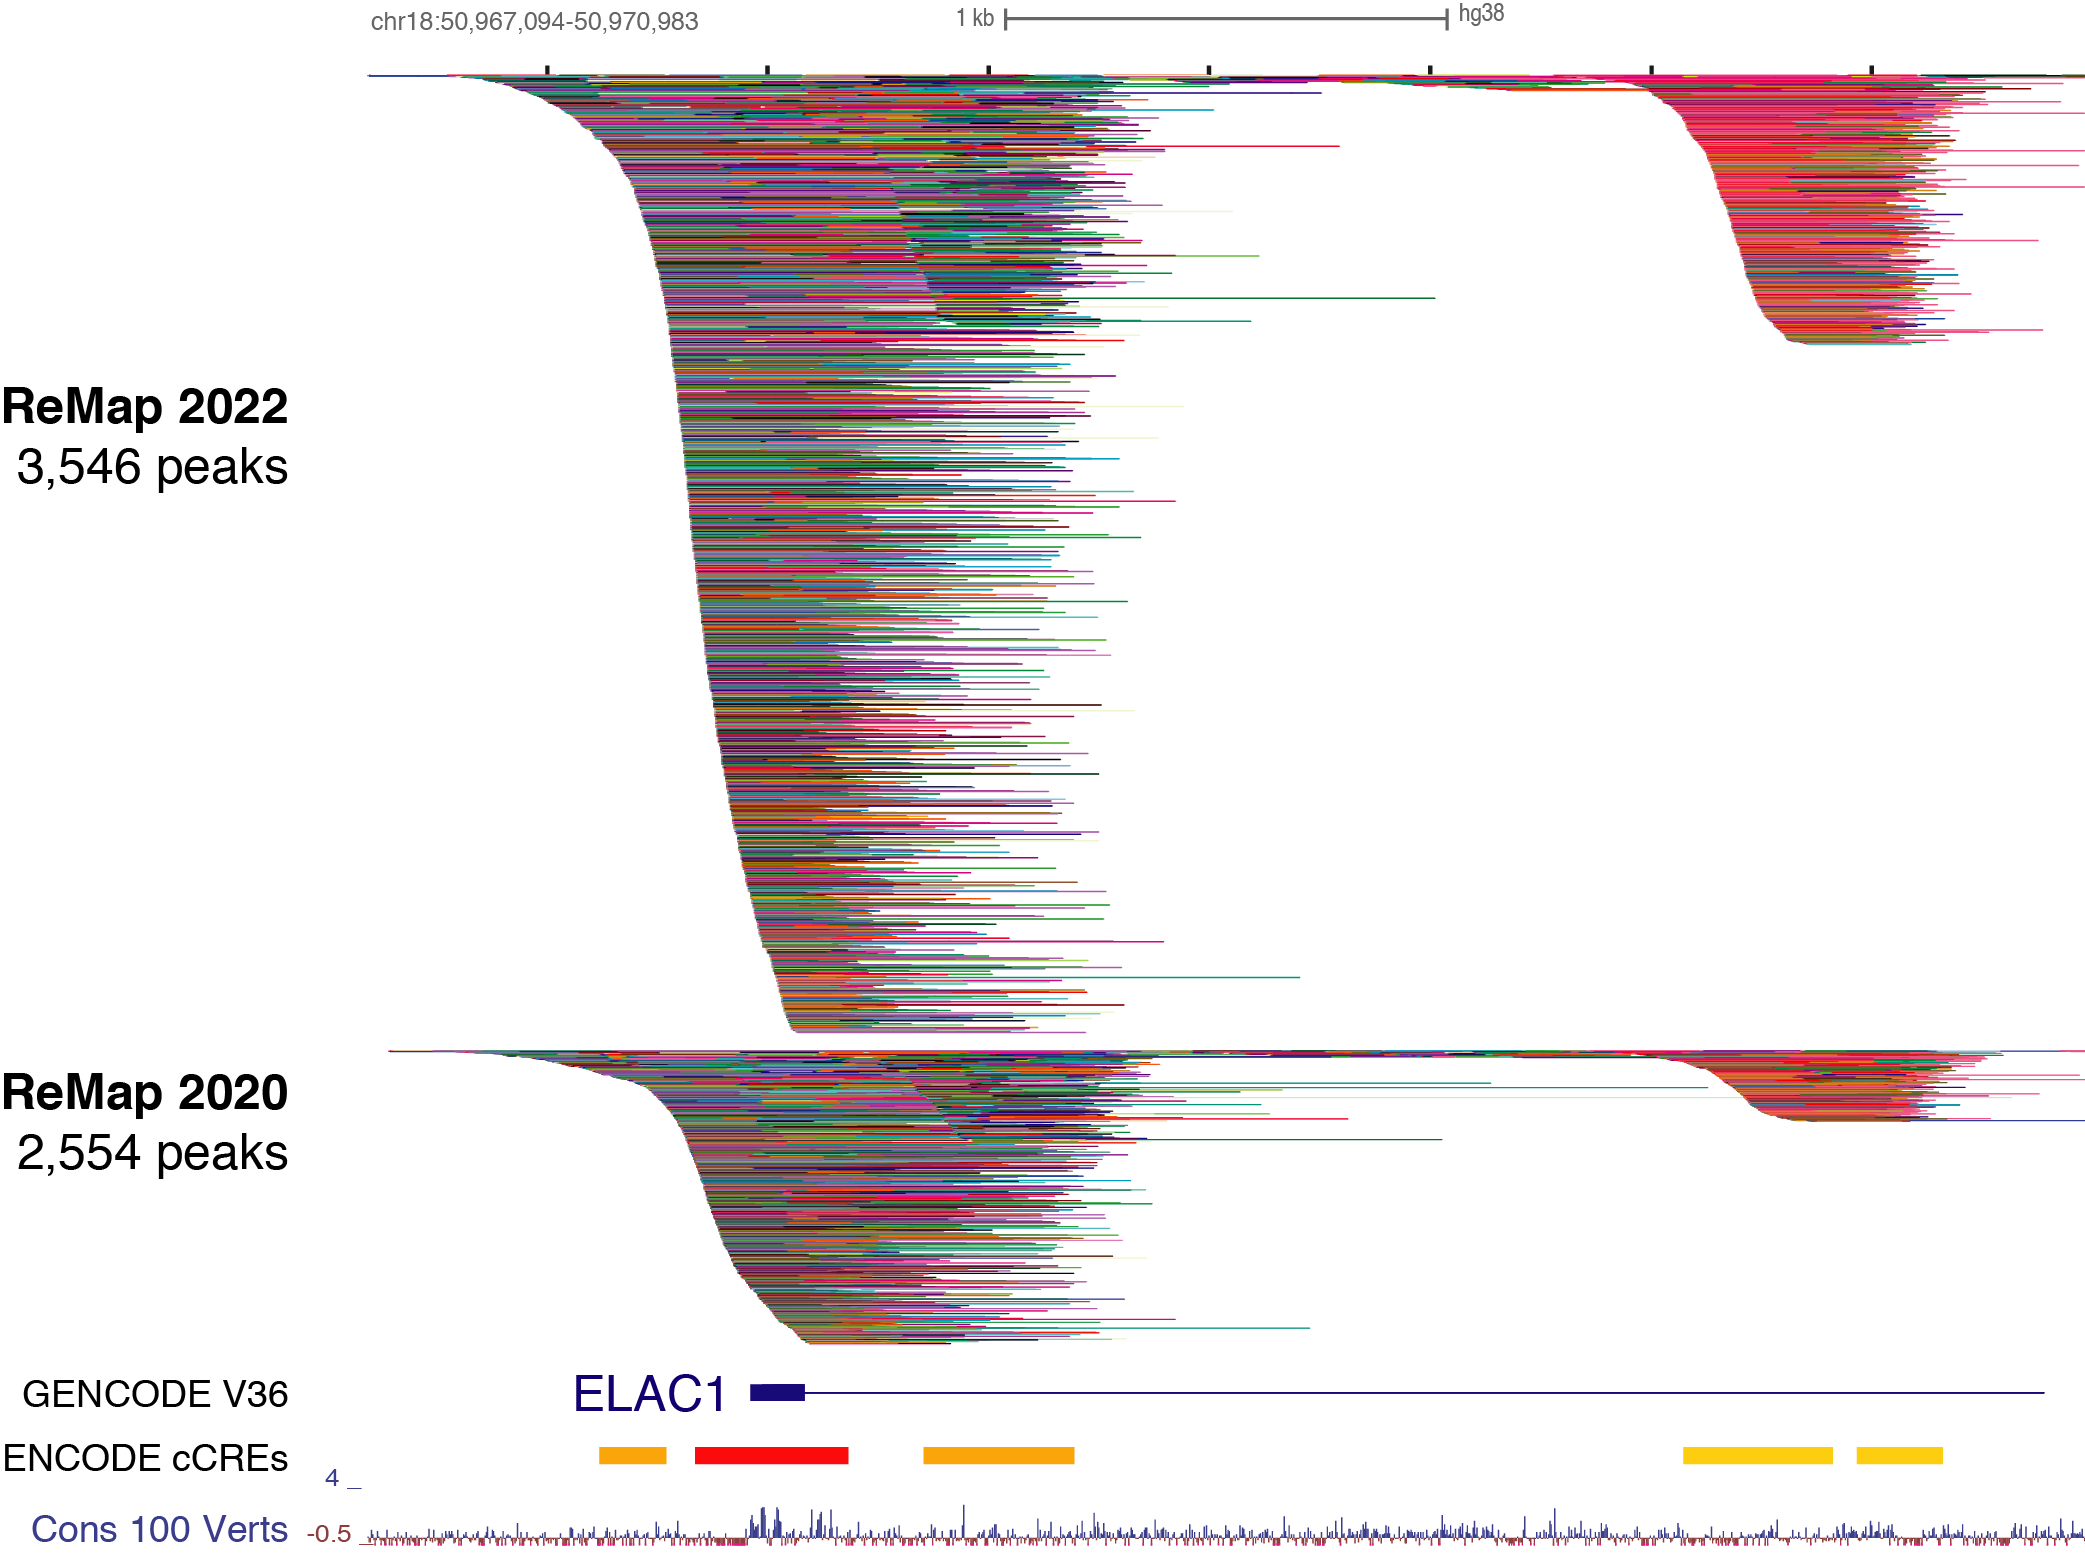
Description of ReMap 2022 for Homo sapiens
This 4th release of ReMap (2022) present the analysis of a total of 8,103 quality controlled ChIP-seq (n=7,895) and ChIP-exo (n=208) datasets from public sources (GEO, ArrayExpress, ENCODE). Those ChIP-seq/exo datasets have been mapped to the GRCh38/hg38 human assembly. Here we define a "dataset" as a ChIP-seq experiment in a given series (e.g. GSE46237), for a given TF (e.g. NR2C2), in a particular biological condition (i.e. cell line, tissue type, disease state or experimental conditions ; e.g. HELA). Datasets were labeled by concatenating these three pieces of information such as GSE46237.NR2C2.HELA.
Those merged analyses covers a total of 1,211 DNA-binding protein (transcriptional regulators) such as a variety of transcription factors (TFs), transcription co-activators (TCFs) and chromatin-remodeling factors (CRFs) for 182 million peaks.
Individual BED files for specific TFs, or Cells/Biotypes or Datasets can be found and downloaded on the ReMap website http://remap.univ-amu.fr/ or at http://remap2022.univ-amu.fr/.
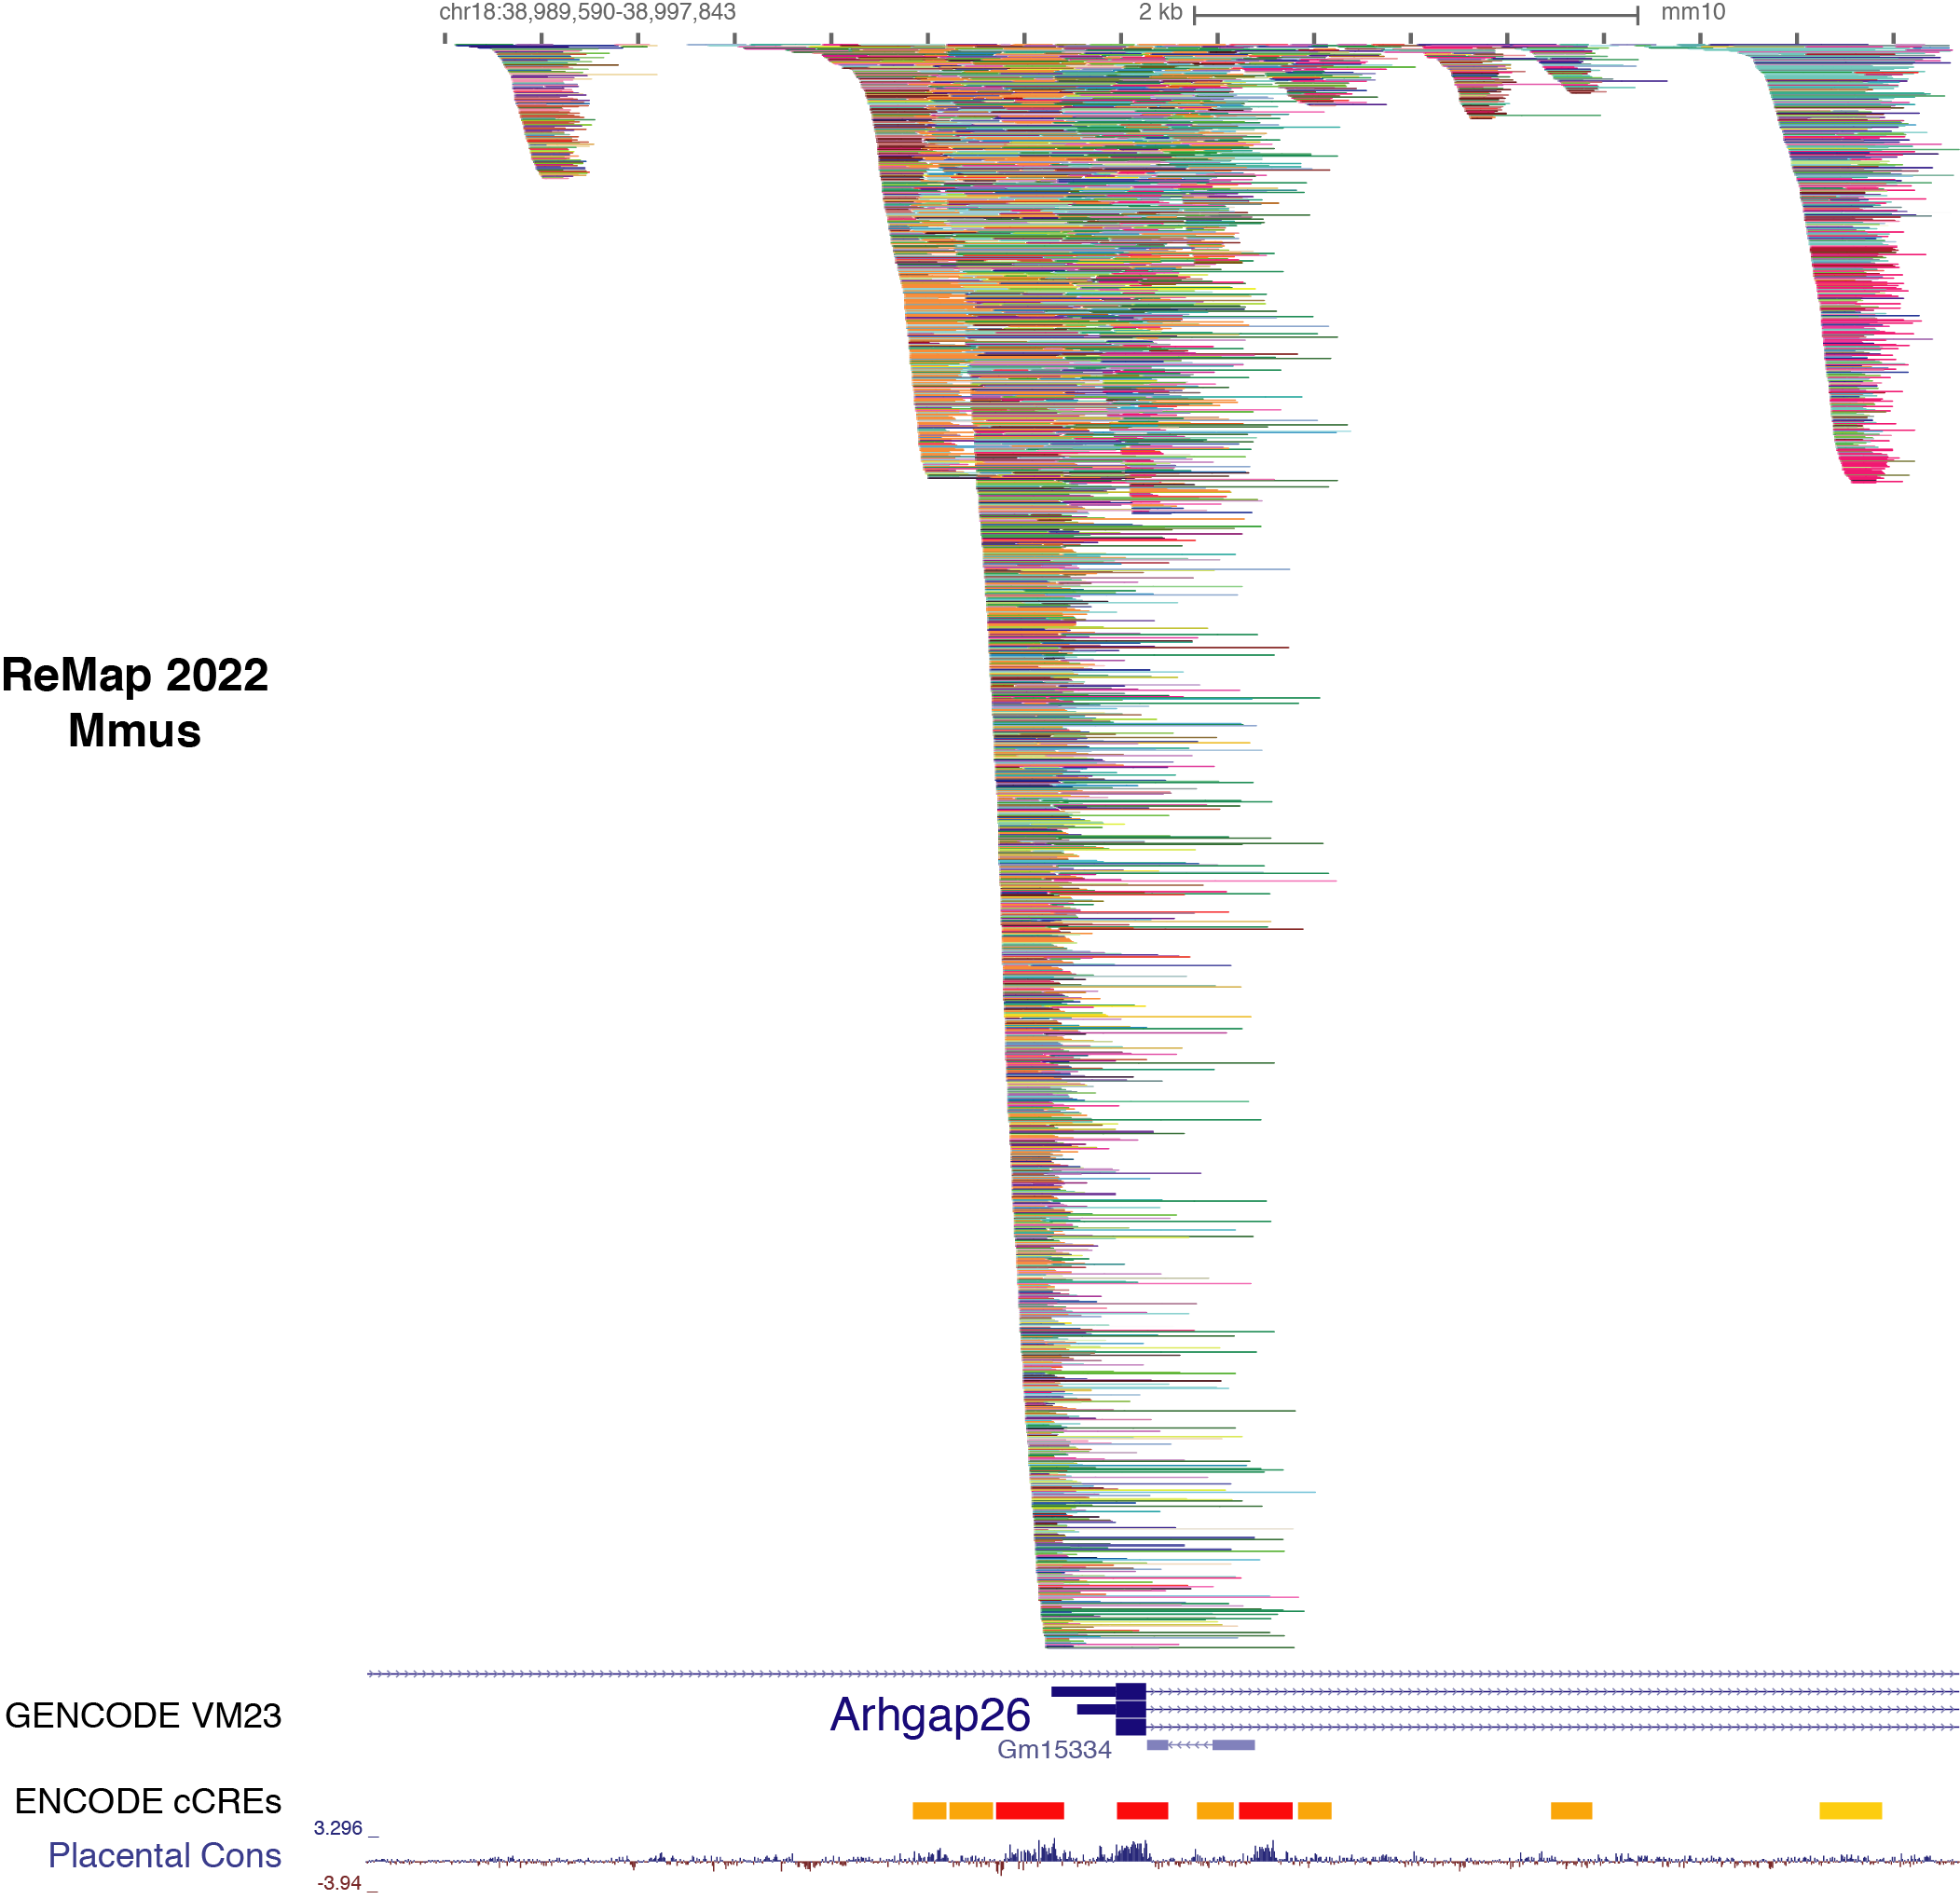
Description of ReMap 2022 for Mus musculus
This release of ReMap (2022) present the analysis of 5,505 quality controlled mouse ChIP-seq (n=7,317 before QCs) from public sources (GEO & ENCODE). Those ChIP-seq datasets have been mapped to the GRCm38/mm10 mouse assembly. Here we define a "dataset" as a ChIP-seq experiment in a given series (e.g. GSE122715), for a given TF (e.g. USF1), in a particular biological condition (i.e. cell line, tissue type, disease state or experimental conditions ; e.g. mESC). Datasets were labeled by concatenating these three pieces of information such as GSE122715.USF1.mESC.
Those merged analyses covers a total of 656 DNA-binding protein (transcriptional regulators) such as a variety of transcription factors (TFs), transcription co-activators (TCFs) and chromatin-remodeling factors (CRFs) for 123 million peaks.
Individual BED files for specific TFs, or Cells/Biotypes or Datasets can be found and downloaded on the ReMap website http://remap.univ-amu.fr/ or at http://remap2022.univ-amu.fr/.
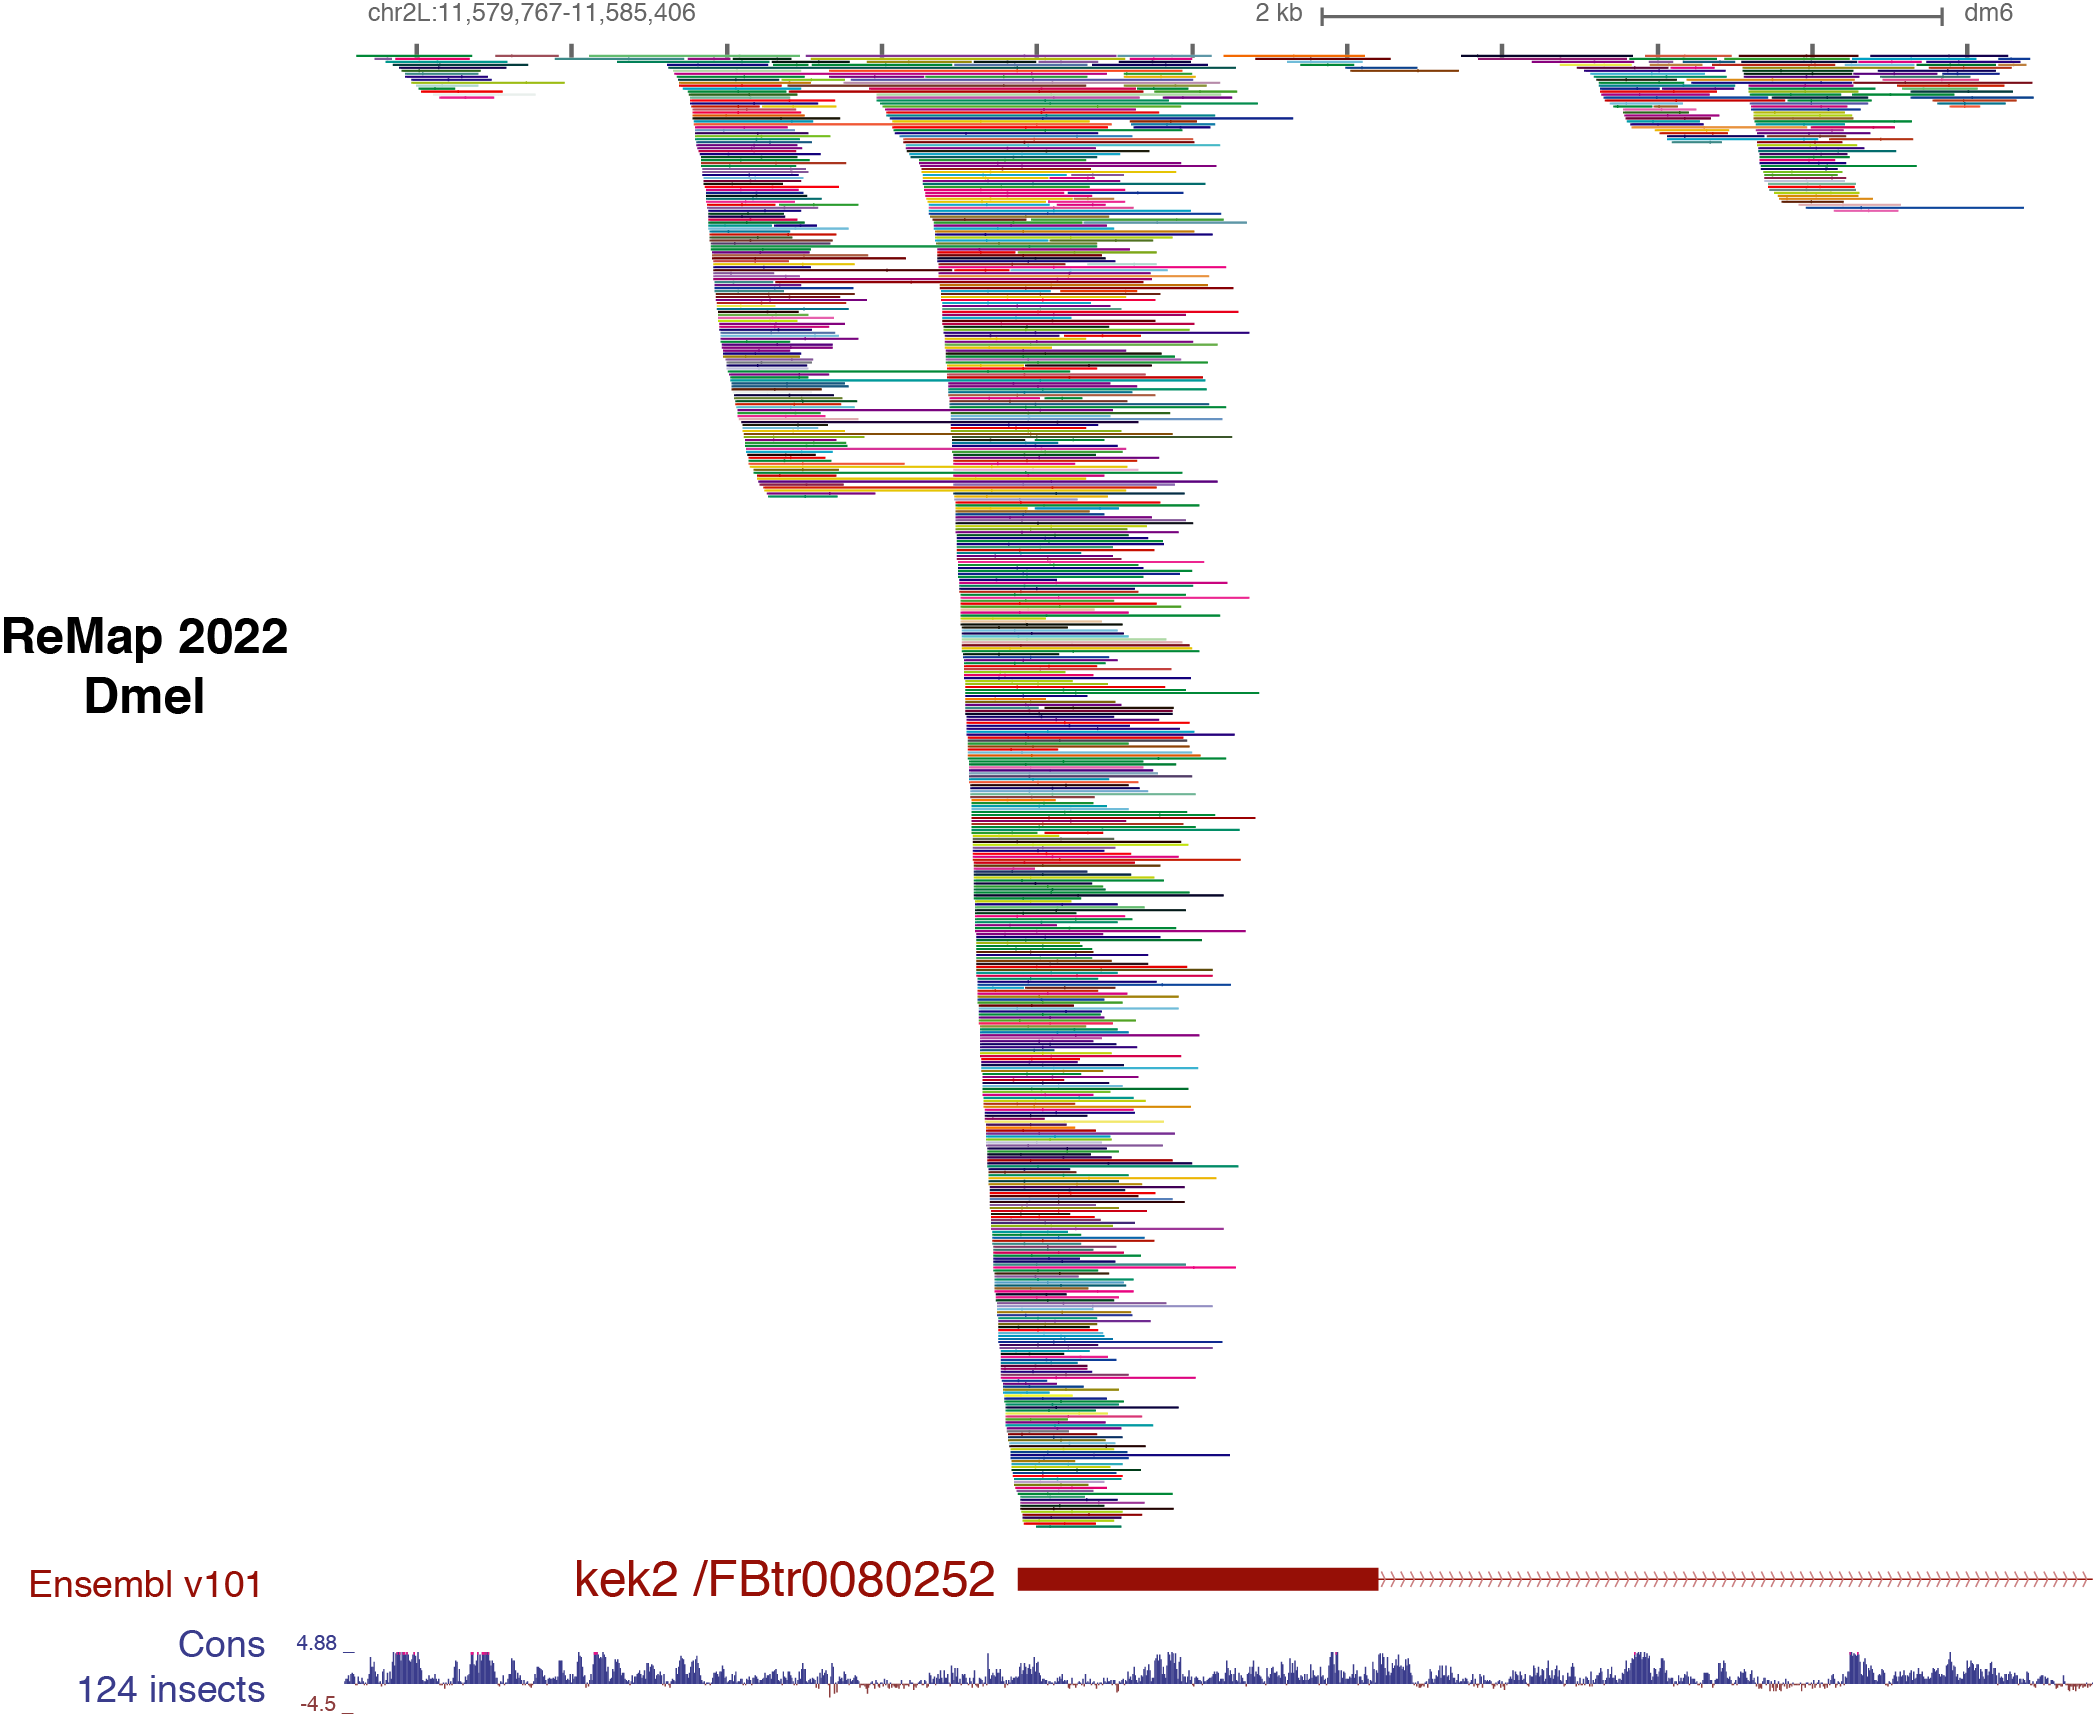
Description of ReMap 2022 for Drosophila melanogaster
This 4th release of ReMap (2022) present the analysis of 1,206 quality controlled ChIP-seq (n=1,315 before QCs) datasets from public sources (GEO, ENCODE). Those ChIP-seq datasets have been mapped to the dmel6 drosophila assembly. Here we define a "dataset" as a ChIP-seq experiment in a given series (e.g. GSE107059), for a given TF (e.g. Trl ), in a particular biological condition (i.e. cell line, tissue type, disease state or experimental conditions ; e.g. Schneider-2). Datasets were labeled by concatenating these three pieces of information such as GSE107059.Trl.Schneider-2.
Those merged analyses covers a total of 550 DNA-binding protein (transcriptional regulators) such as a variety of transcription factors (TFs), transcription co-activators (TCFs) and chromatin-remodeling factors (CRFs) for 16 million peaks.
Individual BED files for specific TFs, or Cells/Biotypes or Datasets can be found and downloaded on the ReMap website http://remap.univ-amu.fr/ or at http://remap2022.univ-amu.fr/.
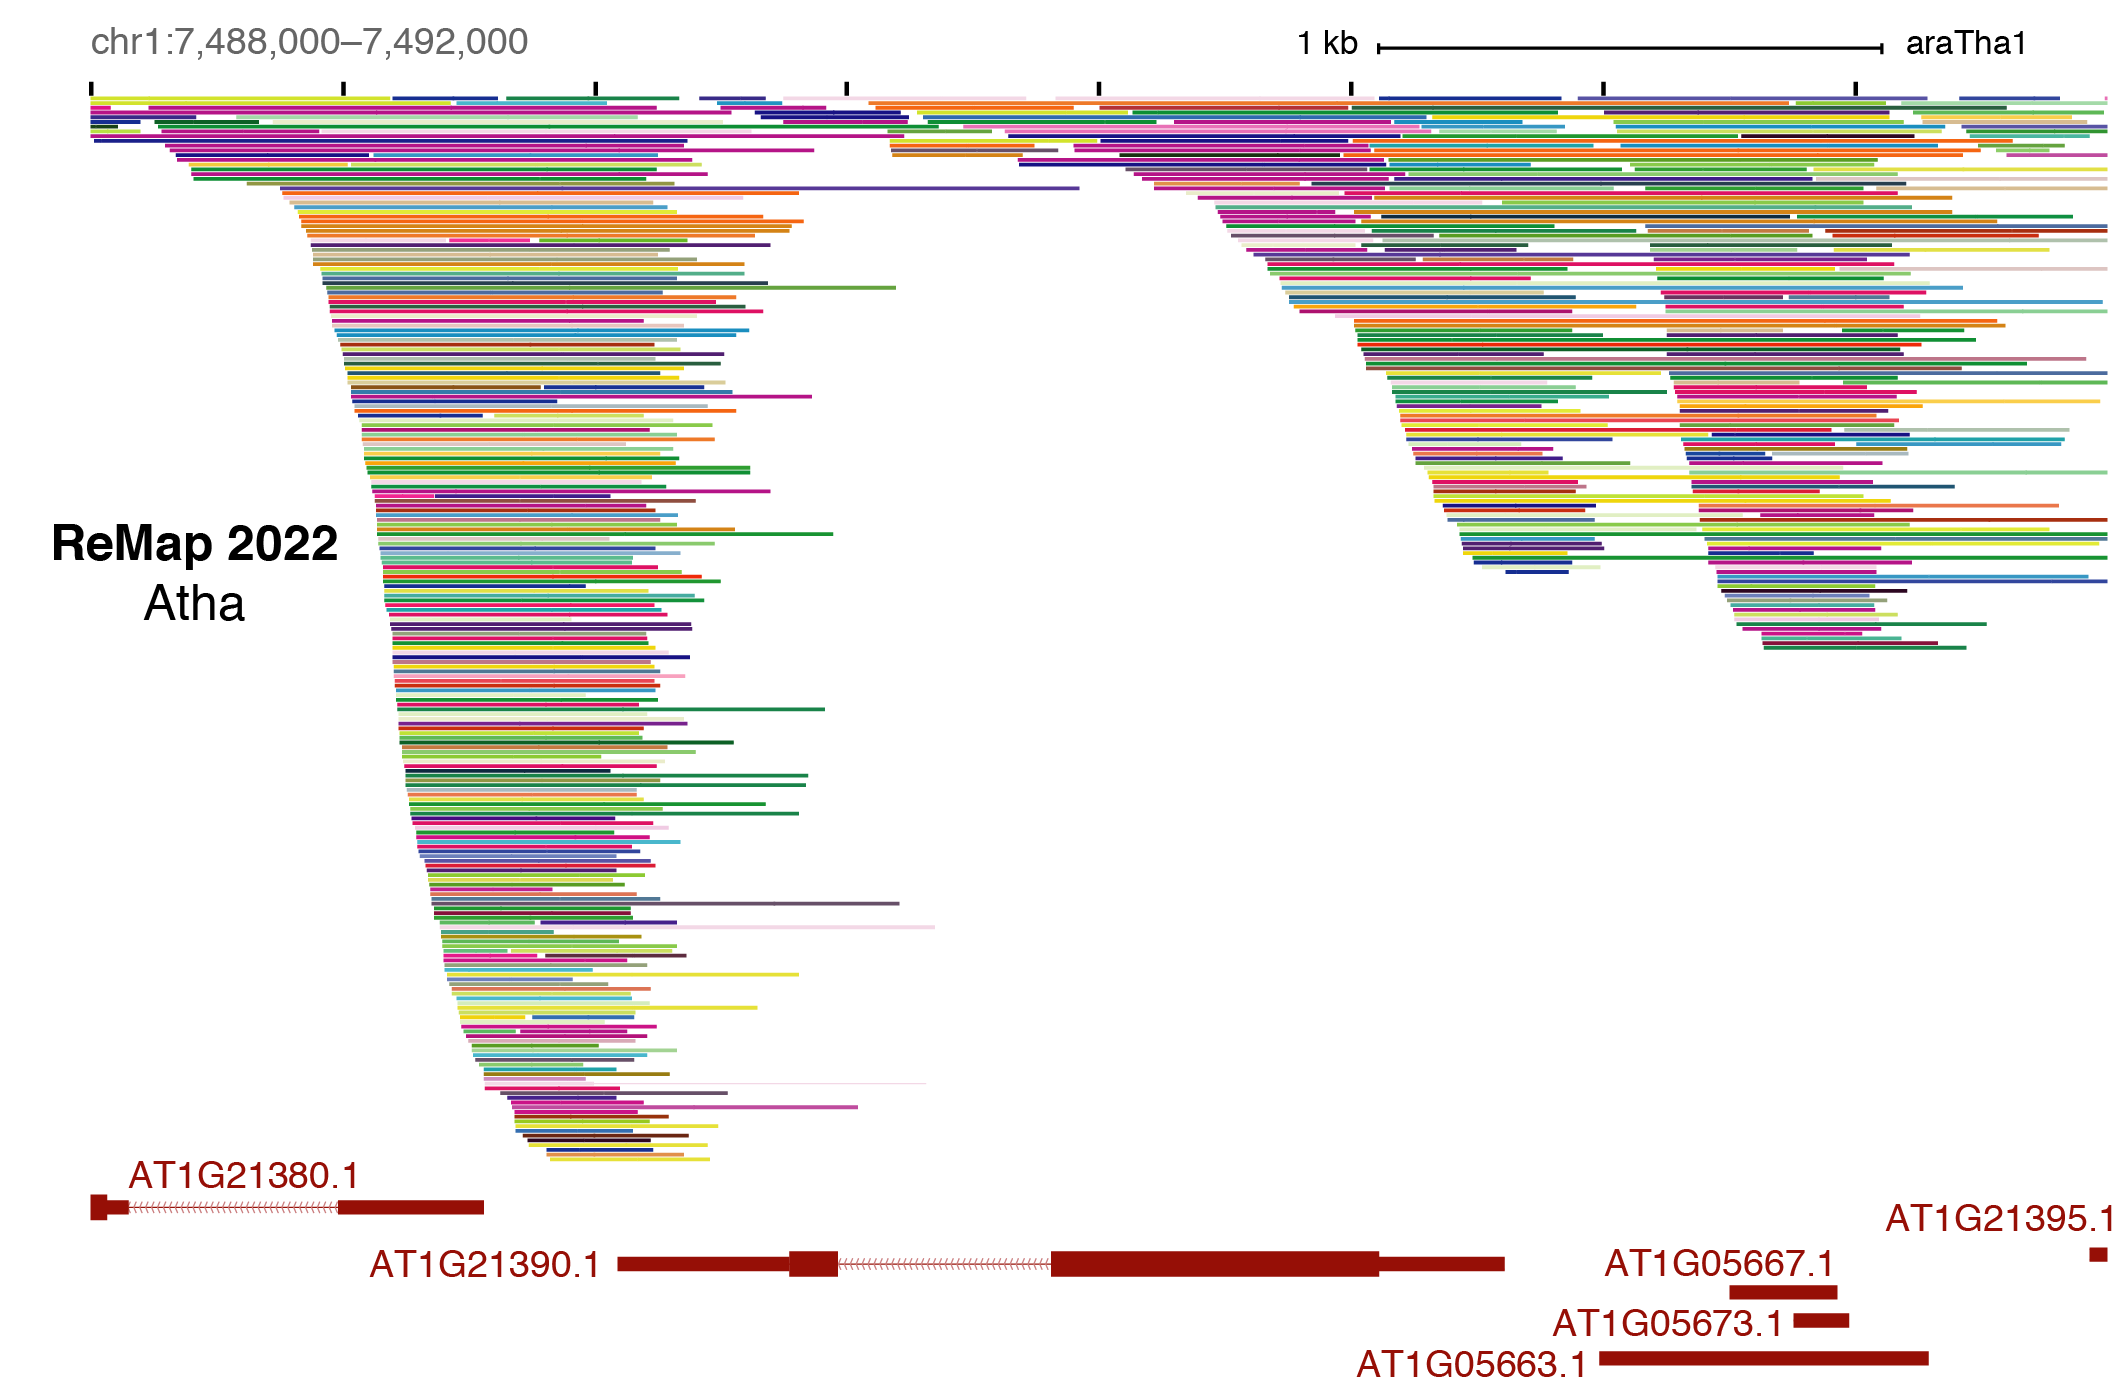
Description of ReMap 2022 for Arabidopsis thaliana
This track hub represents the ReMap Atlas of regulatory regions which consists in a large scale integrative analysis of all Public ChIP-seq data (and DAP-seq) for transcriptional regulators from NCBI-GEO.
We analysed 796 quality controlled ChIP-seq/DAP-seq experiments from the GEO data wharehouse. Those ChIP-seq (n=179 TRs, n=287 Histones), DAP-seq (n=330) datasets have been mapped to the TAIR10 assembly. Here we define a "dataset" as a ChIP-seq experiment in a given series (e.g. GSE94486), for a given target (e.g. ARR1), in a particular biological condition (i.e. ecotype, tissue type, experimental conditions ; e.g. Col-0_seedling_3d-6BA-4h).
Datasets were labeled by concatenating these three pieces of information such as GSE94486.NR2C2.Col-0_seedling_3d-6BA-4h.
Individual BED files for specific TFs, or Cells/Biotypes or Datasets can be found and downloaded on the ReMap website http://remap.univ-amu.fr/ or at http://remap2022.univ-amu.fr/.
Display Conventions and Configuration
-
Each transcription factor follow a specific RGB color.
-
ChIP-seq peak summits are represented by vertical bars.
-
Hsap : A data set is defined as a ChIP/Exo-seq experiment in a given GEO/ArrayExpress/ENCODE series (e.g. GSE41561), for a given TF (e.g.: ESR1), in a particular biological condition (e.g. MCF-7).
Data sets are labelled with the concatenation of these three pieces of information (e.g. GSE41561.ESR1.MCF-7).
-
Atha : we define a “dataset” as a ChIP-seq experiment in a given series (e.g. GSE94486), for a given target (e.g. ARR1), in a particular biological condition (i.e. ecotype, tissue type, experimental conditions ; e.g. Col-0_seedling_3d-6BA-4h).
Data sets are labelled with the concatenation of these three pieces of information (e.g. GSE94486.ARR1.Col-0_seedling_3d-6BA-4h).
Methods
Human Data sets sources
GEO & ArrayExpress
Public ChIP-seq data sets were extracted from Gene Expression Omnibus (GEO) and ArrayExpress (AE) databases. For GEO, the query '('chip seq' OR 'chipseq' OR 'chip sequencing') AND 'Genome binding/occupancy profiling by high throughput sequencing' AND 'homo sapiens'[organism] AND NOT 'ENCODE'[project]' was used to return a list of all potential data sets to analyse, which were then manually assessed for further analyses. Data sets involving polymerases (i.e. Pol2 and Pol3), and some mutated or fused TFs (e.g. KAP1 N/C terminal mutation, GSE27929) were exckuded.
ENCODE Human, Mouse, Drosophila
Available ENCODE ChIP-seq data sets for transcriptional regulators from www.encodeproject.org portal were processed with the our uniform workflow. We retrieved the list of ENCODE data as FASTQ files from the ENCODE portal (https://www.encodeproject.org/) using the following filters: Assay: "ChIP-seq", Organism: "Homo sapiens", Target of assay: "transcription factor", Available data: "fastq" on 2016 June 21st. Metadata information in JSON format and FASTQ files were retrieved using the Python requests module.
Human, Mouse, Drosophila ChIP-seq processing
Both Public and ENCODE data were processed similarly. Bowtie 2 (PMC3322381) (version 2.2.9) with options -end-to-end -sensitive was used to align all reads on the human genome (GRCh38/hg38 assembly). Biological and technical replicates for each unique combination of GSE/TF/Cell type or Biological condition were used for peak calling. TFBS were identified using MACS2 peak-calling tool (PMC3120977) (version 2.1.1.2) in order to follow ENCODE ChIP-seq guidelines, with stringent thresholds (MACS2 default thresholds, p-value: 1e-5). An input data set was used when available.
Arabidopsis Data sets sources
After consistent peak calling across datasets, we identified 1.9 million peaks bound by transcriptionnal regulators from ChIP-seq data and 0.8 million from DAP-seq data (GSE60141), giving a regulatory atlas of 2.6 million peaks. These numbers may include overlapping sites for identical TR targets which were studied in various conditions. To address this we merged overlapping TRs binding regions for similar TRs obtaining a catalogue of 1.8 million non-redundant binding sites.
Finally we also applied our pipeline to all available histone ChIP-seq data and identifed 4.5 million broad and gapped peaks.
Arabidopsis ChIP-seq processing
Both ChIP-seq and DAP-seq data were processed similarly. Bowtie 2 (PMC3322381) (version 2.2.9) with options -end-to-end -sensitive was used to align all reads on the human genome (GRCh38/hg38 assembly). Biological and technical replicates for each unique combination of GSE/TF/Cell type or Biological condition were used for peak calling. TFBS were identified using MACS2 peak-calling tool (PMC3120977) (version 2.1.1.2) in order to follow ENCODE ChIP-seq guidelines, with stringent thresholds (MACS2 default thresholds, p-value: 1e-5). An input data set was used when available.
Human, Mouse, Drosophila & Arabidopsis Quality assessment
To assess the quality of public data sets, we computed a score based on the cross-correlation and the FRiP (fraction of reads in peaks) metrics developed by the ENCODE Consortium (http://genome.ucsc.edu/ENCODE/qualityMetrics.html). Two thresholds were defined for each of the two cross-correlation ratios (NSC, normalized strand coefficient: 1.05 and 1.10; RSC, relative strand coefficient: 0.8 and 1.0). Detailed descriptions of the ENCODE quality coefficients can be found at http://genome.ucsc.edu/ENCODE/qualityMetrics.html. We used the phantompeak tools suite (https://code.google.com/p/phantompeakqualtools/) to compute RSC and NSC.
Full details of our methods can be found in the references below.
Data Availability
The ReMap BED files for all version [2022, 2020, 2018, 2015] are available for download at the ReMap website http://remap.univ-amu.fr/ in the download tab.
Papers to cite
-
Hammal F., De Langen P., Arquier N., Perrin L., Bergon A., Lopez F., Ballester B.
ReMap 2022: A database of Human, Mouse, Drosophila and Arabidopsis regulatory regions from an integrative analysis of DNA-binding sequencing experiments
Nucleic Acids Research (2022) https://doi.org/10.1093/nar/gkab996.
-
Cheneby J., Menetrier Z., Mestdagh M., Rosnet T., Douida A., Rhalloussi W., Bergon A., Lopez F., Ballester B.
ReMap 2020: A database of regulatory regions from an integrative analysis of Human and Arabidopsis DNA-binding sequencing experiments.
Nucleic Acids Research (2020) https://doi.org/10.1093/nar/gkz945.
-
Cheneby J., Gheorghe M., Artufel M., Mathelier A., Ballester, B.
ReMap 2018: An updated regulatory regions atlas from an integrative analysis of DNA-binding ChIP-seq experiments.
Nucleic Acids Research (2018) https://doi.org/10.1093/nar/gkx1092.
-
Griffon A., Barbier Q., Dalino J., van Helden J., Spicuglia S., Ballester B.
Integrative analysis of public ChIP-seq experiments reveals a complex multi-cell regulatory landscape.
Nucleic Acids Research (2015) https://doi.org/10.1093/nar/gku1280.
Contact
If you have questions or comments, please write to:
|
|